
#BTC Weekly
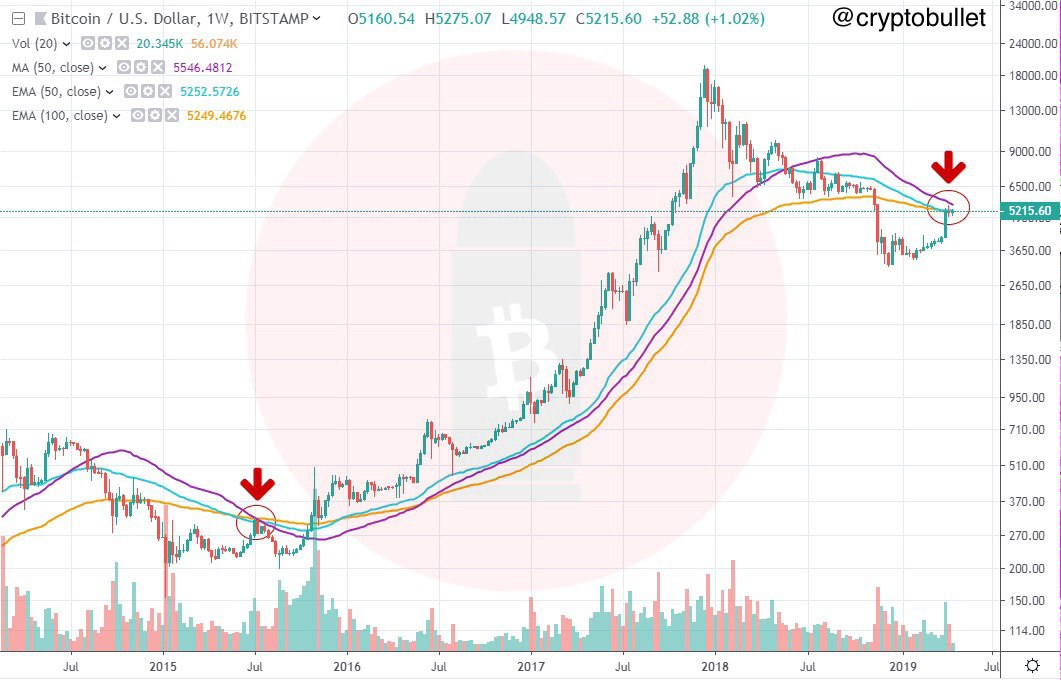
On the weekly chart we see that the previous week closed as a doji at the top, which looks like a potential evening star doji pattern (bearish reversal formation). 4600-4800 is the first target zone for the correction.
The price still has room for some upside, but it's limited by the 50-Week MA (currently at 5550): we may get to it and reverse there.
Pay attention to the 50-Week MA, 50-Week EMA & 100-Week EMA. Look how they nicely align and form a significant resistance cluster. Again! Back in 2015 they rejected the price which led to a very nasty 30% drop.
This time around it may be different and we will blast through the MAs (which is doubtful), but buying at a strong resistance is not a good idea.
ߋ cryptobullet